Data Handling Class 7 Ex. 3.3;
New Ncert Solution for Class-7 Maths Chapter 3 Data Handling Free Solution;
Exercise 3.3
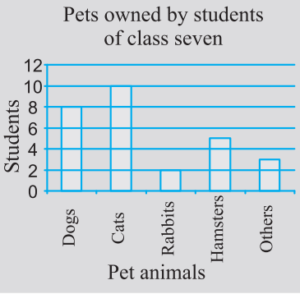
Question-1:- Use, the bar graph; to answer the following questions.
(a) Which is the most popular pet?
(b) How-many-students, have dog as a-pet?
Solution 1:-
From the above, given bar graph(in figure);
(a) Cats, the pet that students adore the most..
(b) A dog is the pet of 8 students.
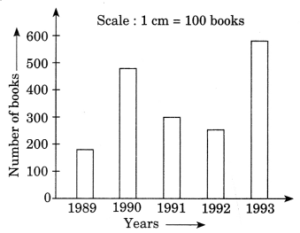
Question 2 :- Read, the bar-graph, which shows the number of books sold by a book-store during five – consecutive-years and answer the following questions below:
(i) About, how-many books, were sold in 1989, 1990, 1992?
(ii) In-which-year, were about 475-books, sold? About 225-books, sold?
(iii) In-which-year, were fewer than 250-books, sold?
(iv) Can you explain, how would you estimate, the number of books, sold in 1989?
Solution 2:-
From the given bar-graph, we have
(i) In 1989, around 180 books were sold; in 1990, approximately 490; and in 1992, approximately 295.
(ii) In 1990, about 475 books were sold and in 1992, about 225 books were sold.
(iii) The total number of books sold between 1989 and 1992 was less than 250.
(iv) The line on the y-axis is split into ten segments, each consisting of ten books. Thus, we can calculate that roughly 180 books were sold in 1989.
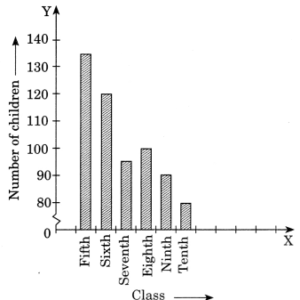
Question 3:- Number of childrens, in six-different-classes, are given below. Represent, the-data on a bar graph.
| Class | Number of children |
| Fifth | 135 |
| Sixth | 120 |
| Seventh | 95 |
| Eighth | 100 |
| Ninth | 90 |
| Tenth | 80 |
(a) How would you choose a scale?
(b) Answer the following questions:
(i) In-which class has the maximum number of children? And the minimum?
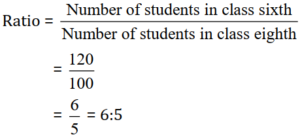
(ii) Find the ratio of students of class 6th to the students of class 8th.
Solution 3:-
(a) Scale on y-axis, is 1 cm = 10 students
(b)
(i) 5th class has the maximum number of children, 135.
10th class has the minimum number of children, 80.
(ii)
Question 4 :- The performance of a student in 1st term and 2nd term is given. Draw a double-bar-graph choosing appropriate-scale and answer the followings:
| Subject | 1st term (M.M. 100) | 2nd term (M.M. 100) |
| English | 67 | 70 |
| Hindi | 72 | 65 |
| Math | 88 | 95 |
| Science | 81 | 85 |
| S. Science | 73 | 75 |
(i) In which subject, has the child improved his performances the most?
(ii) In which subject is the improvements the-least?
(iii) Has the performances gone down in any-subject?
Solution 4:-
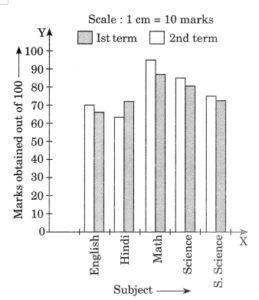
(i) In Math subject, the performance of the students improved the most.
(ii) In social science subject, the performance of the students improved the least.
(iii) In Hindi subject, the performance of the students has gone down.
Question 5 :- Consider this data collected from the survey of a colony.
| Favourite sport | Watching | Participating |
| Cricket | 1240 | 620 |
| Basket ball | 470 | 320 |
| Swimming | 510 | 320 |
| Hockey | 430 | 250 |
| Athletics | 250 | 105 |
(i) Draw a double bar graph choosing an appropriate scale. What do you infer, from the bar-graph?
(ii) Which sport is most popular?
(iii) Which is more-preferred, (watching or participating) in sports?
Solution 5:-
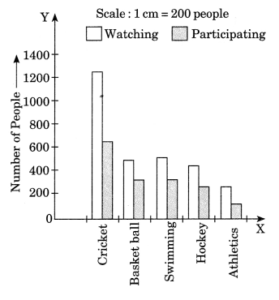
(i) The above bar graph depicts the number of people who are watching and participating in their favorite sports.
(ii) Cricket, is the most popular sport.
(iii) Watching, the sports is more preferred by the people as compared to participating.
Question 6 :- Take the data, giving the minimum and the maximum temperature of various cities given in the beginning of this chapter(Table 3.1). Plot a double bar graph using the data and answer the following:
(i) Which city has the largest-differences in the minimum and maximum temperature on the given date?
(ii) Which is the hottest city and which is the coldest city?
(iii) Name two cities where maximum temperature of one was less than the minimum temperature of the other.
(iv) Name the city which has the least difference between its minimum and the maximum temperature.
| Temperature of cities as on 20.6.2006 | ||
| City | Max. | Min. |
| Ahmedabad | 38°C | 29°C |
| Amritsar | 37°C | 26°C |
| Bengaluru | 28°C | 21°C |
| Chennai | 36°C | 27°C |
| Delhi | 38°C | 28°C |
| Jaipur | 39°C | 29°C |
| Jammu | 41°C | 26°C |
| Mumbai | 32°C | 27°C |
Solution 6:-
Double bar graph:
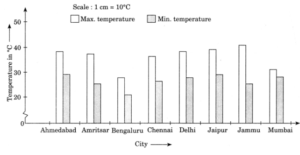
(i) Jammu has the largest difference between the maximum and minimum temperature which is; 41°C – 26°C = 15°C
(ii) Hottest city is Jammu with 41°C temperature and coldest city is Bengaluru with 21°C temperature.
(iii)
- Bengaluru having its maximum temperature which is 28°C, is less than the minimum temperature 29°C in Ahmedabad.
- Bengaluru having its maximum temperature which is 28°C, is less than the maximum temperature 29°C in Jaipur.
(iv) Mumbai has the least difference between its minimum and maximum temperatures which is; 32°C – 27°C = 5°C.